X XFediYour place in the Fediverse
XFEDI

#DataScience

ActivityPub

Public posts with this hashtag.

New post! I looked into Google’s dubious claims in their “Gemini on Google cloud” ad about the full moon’s effect on certain, shall we say, niche baseball stats.

Calling it p-hacking is a bit of an insult to p-hacking because they couldn’t even find statistically significant results.

https://marcoshuerta.com/posts/full-moon-myth/

#baseball #MLB #DataScience #FullMoon

Marcos HuertaThe Full Moon Myth Takes the Field – Marcos HuertaGoogle’s ad on the full moon effect in baseball is a case study in small number statistics
↩ Reply ♡ 0 · ↻ 0 ↗ Original

Episode 245 of the @rstats @rweekly Highlights Podcast is out! https://serve.podhome.fm/episodepage/r-weekly-highlights/246

🌐 Contributing to R Core @R_Foundation @RConsortium
📦 Explosion of package & environment tools @ivelasq3
🧬 Genomes, Prompts, and Shiny (Samual Bharti) @Posit

R Weekly is powered by the community. Visit https://rweekly.org to share resources, and send your hosts a boost using https://podcastindex.org/podcast/1062040 or a new podcast app! https://podcastapps.com

h/t @mike_thomas 🙏

#rstats #datascience #v4v

R Weekly HighlightsIssue 2026-W43 HighlightsWe learn about the variety of ways you can contribute back to the core of R, a roundup of the excellent choices available for package and environment…
↩ Reply ♡ 0 · ↻ 0 ↗ Original

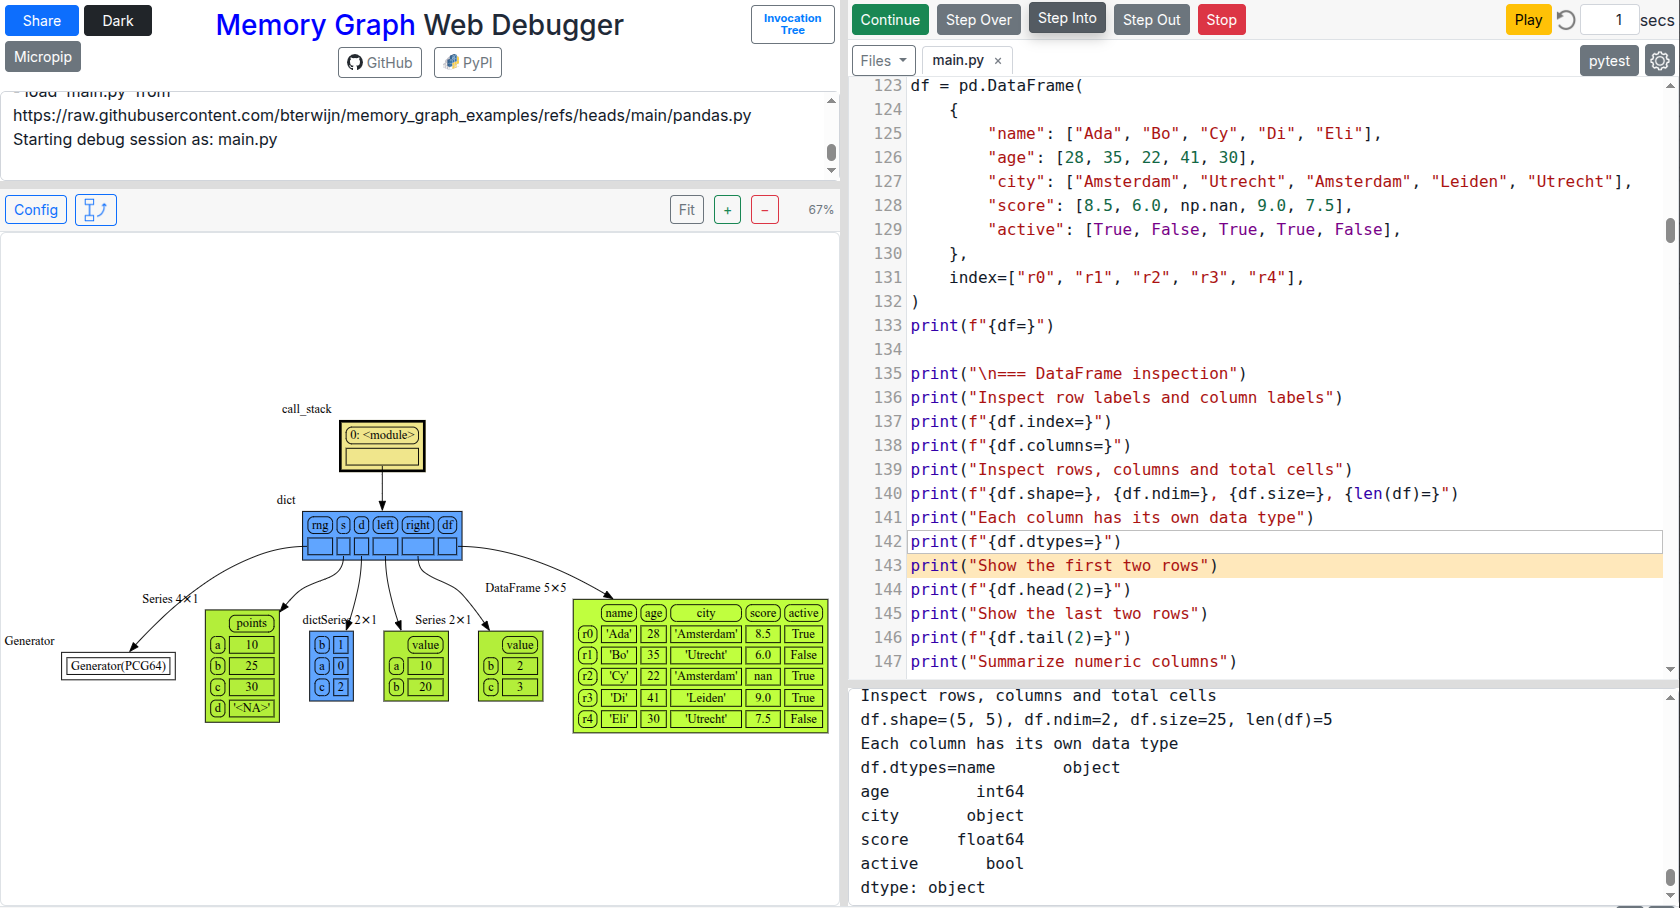
How well do you really know Pandas? 🐼

Pandas makes working with data look simple. But some of its most powerful features can also produce surprising results. 😲

🔍 This interactive 𝗺𝗲𝗺𝗼𝗿𝘆_𝗴𝗿𝗮𝗽𝗵 example explores these concepts and many more, with short explanations for each operation. 👣 Step through the Python code, see what changes, and experiment with your own modifications: 👉 https://memory-graph.com/#micropip=numpy,pandas&codeurl=https://raw.githubusercontent.com/bterwijn/memory_graph_examples/refs/heads/main/pandas.py&timestep=1&play

#Python #memory_graph #Pandas #DataScience

Media attachment
memory-graph.comMemory Graph - Python Debugging and Teaching ToolVisualize Python data structures and call stack. Perfect for understanding references, mutable data types, and shallow/deep copy concepts.
↩ Reply ♡ 0 · ↻ 0 ↗ Original

And we're live for Oct!

Title: Linting and data viz silos
Speakers: Etienne Bacher and Neil Pettinger
Date: Wednesday 21st October 2026, 6.00PM - 7.00PM
Location: 2.11 Appleton Tower, The University of Edinburgh
Register: https://luma.com/nulvgls1

Looking forward to seeing you there.

#RStats #DataScience #DataEngineering #Tech #meetup #Edinburgh #Scotland

@mikerspencer @etiennebacher

luma.comOctober 2026: Linting and data viz silos · LumaTitle: Linting and data viz silos Speakers: Etienne Bacher and Neil Pettinger Date: Wednesday 21st October 2026, 6.00PM - 7.00PM Location: 2.11 Appleton Tower,…
↩ Reply ♡ 0 · ↻ 0 ↗ Original