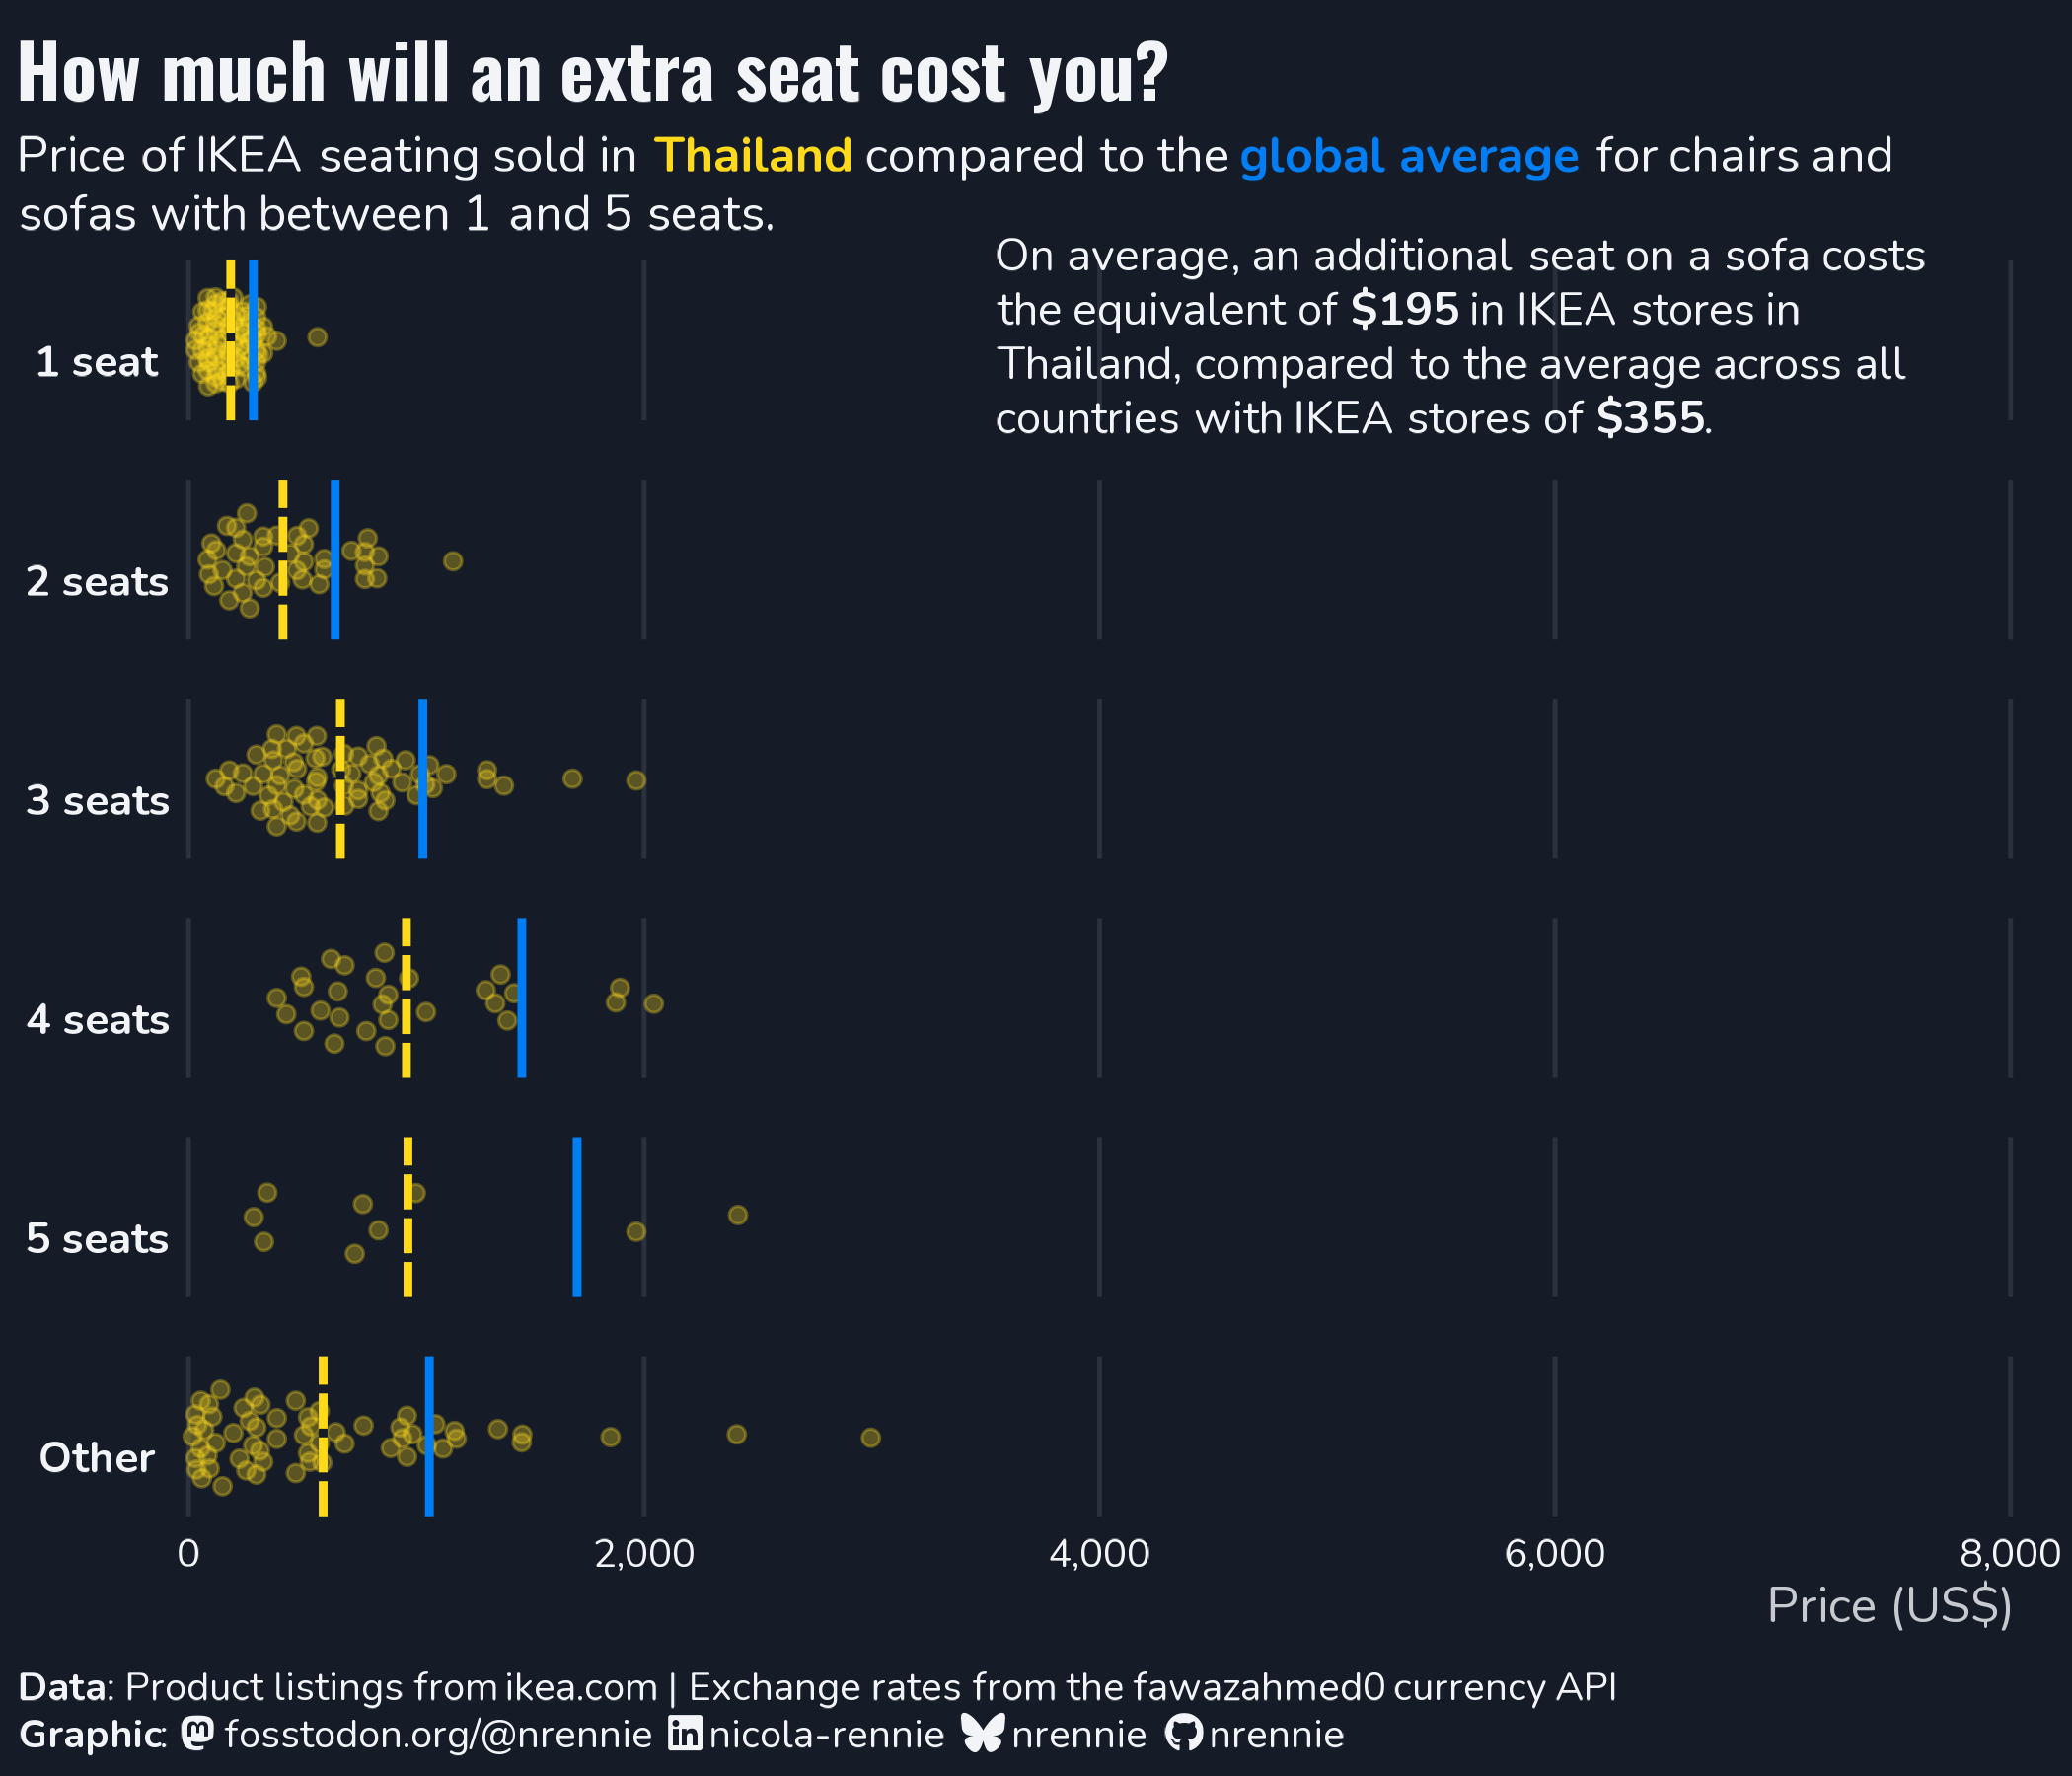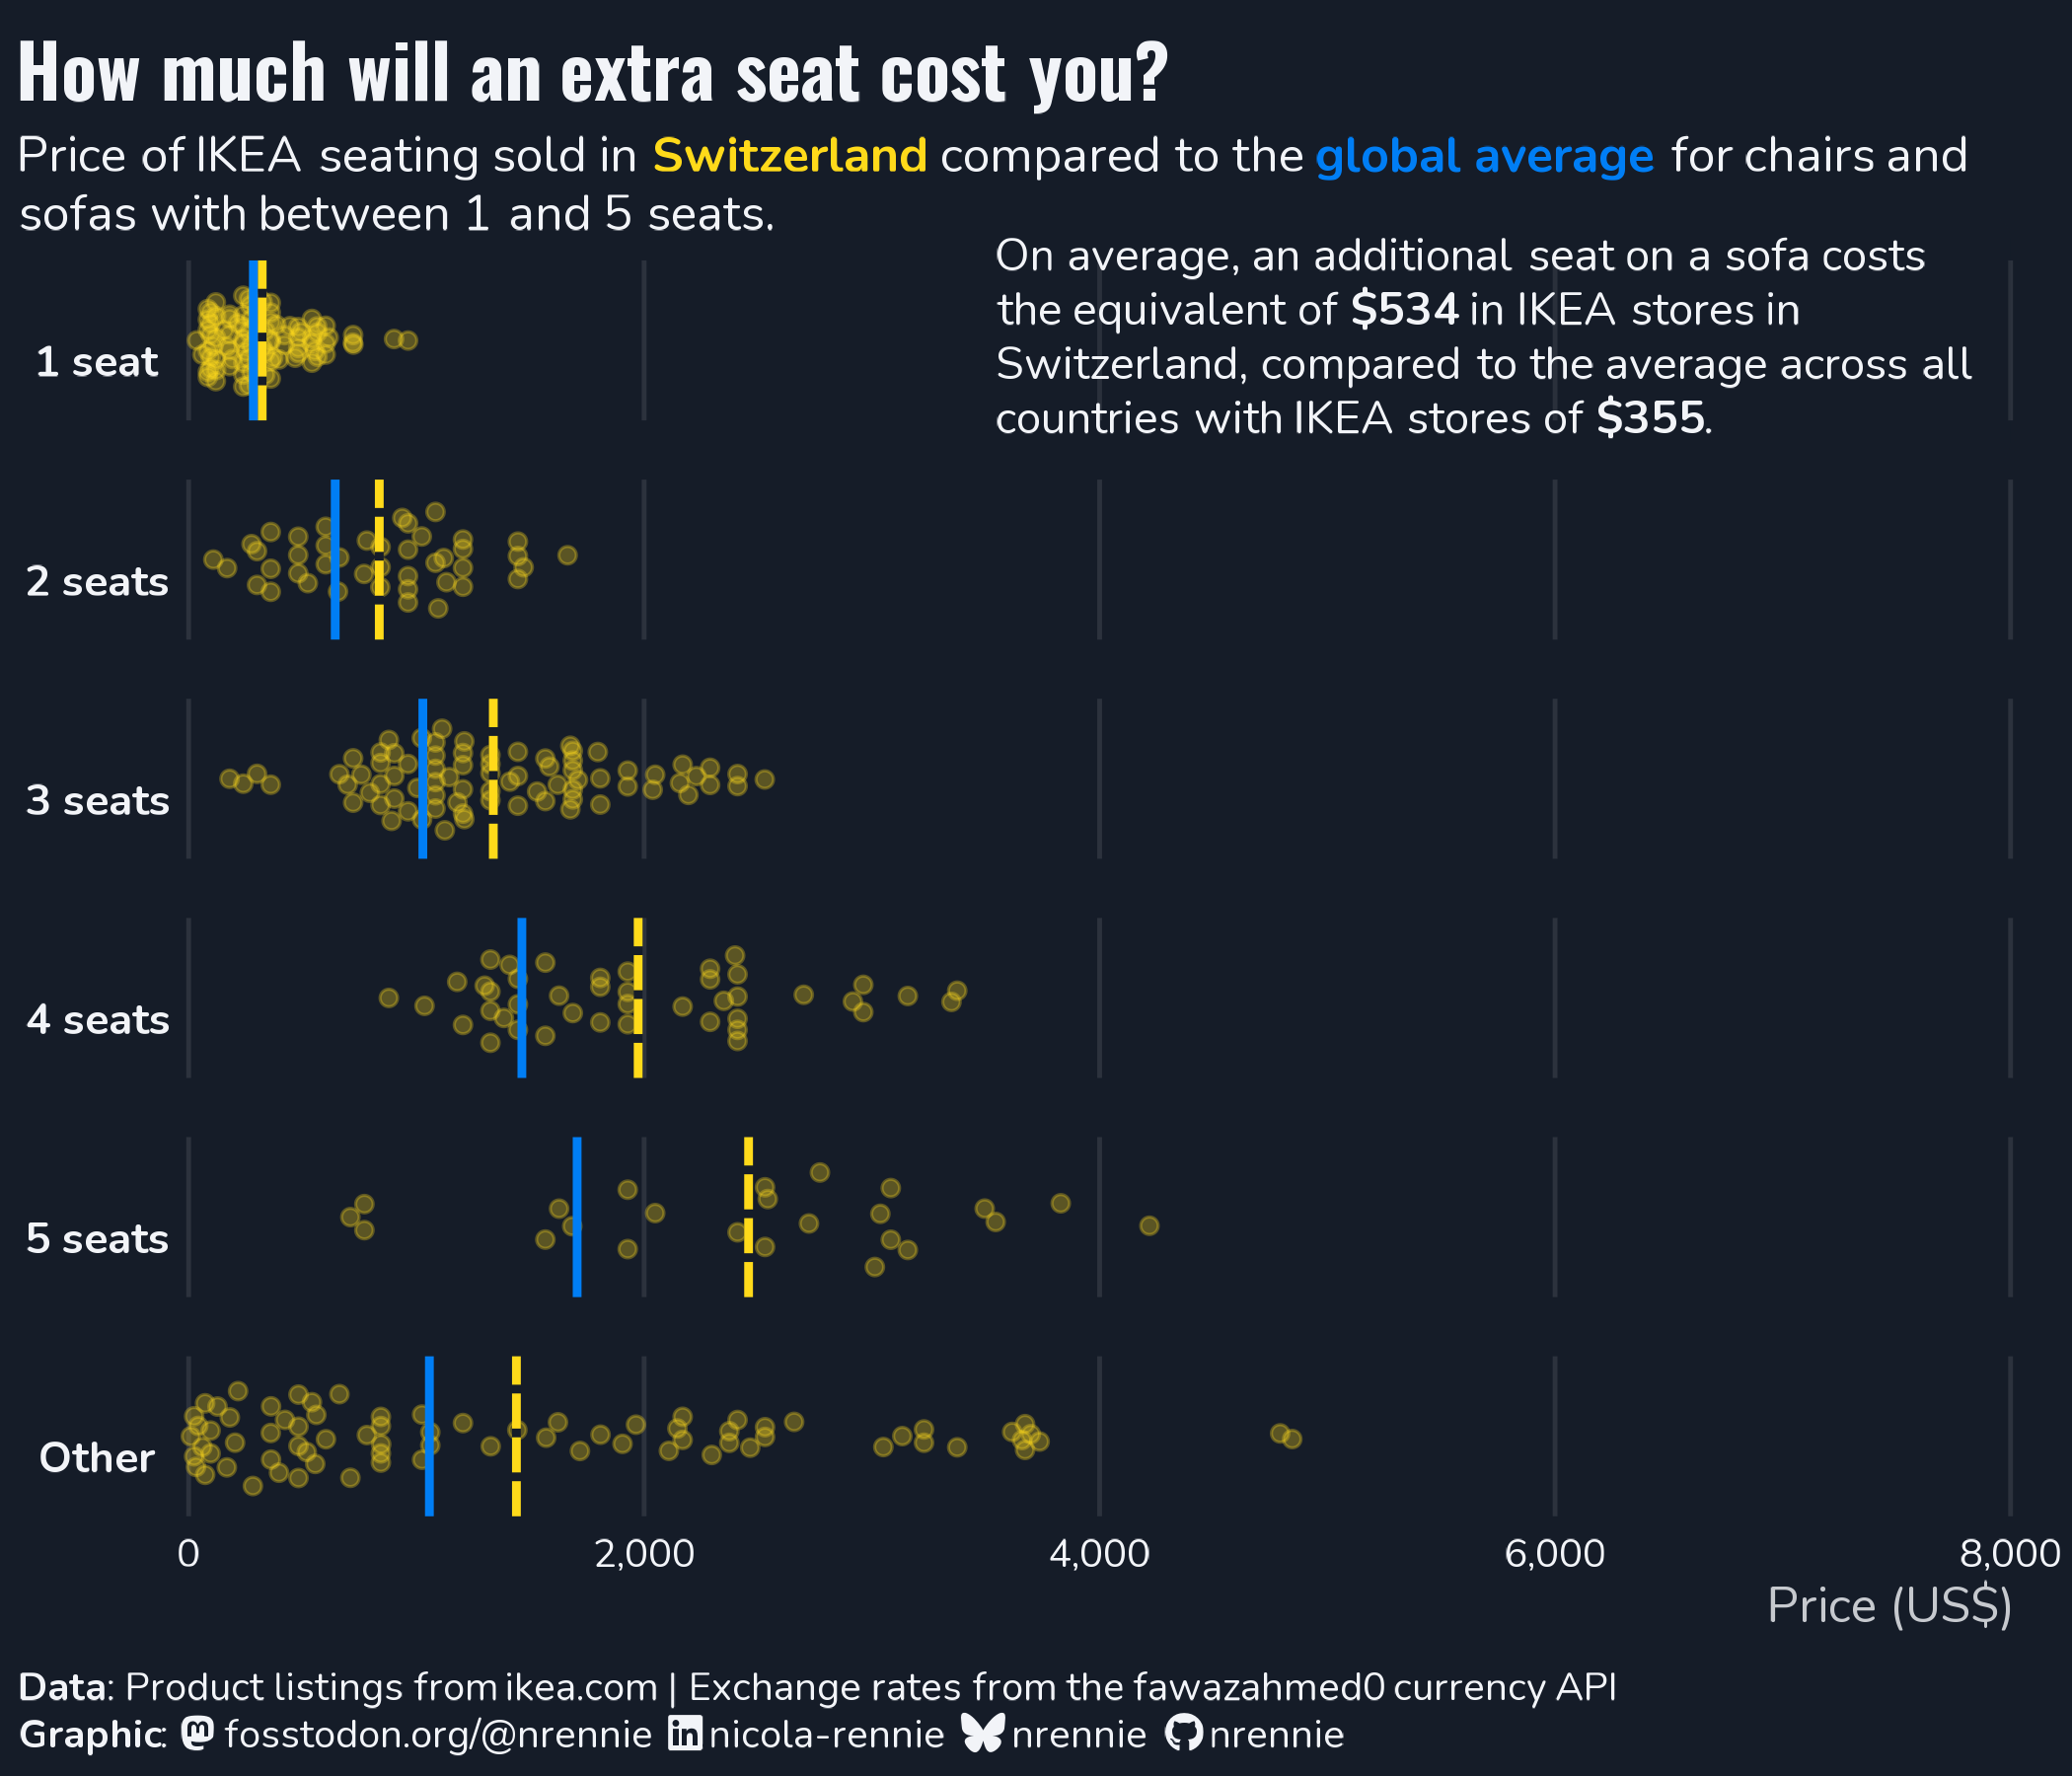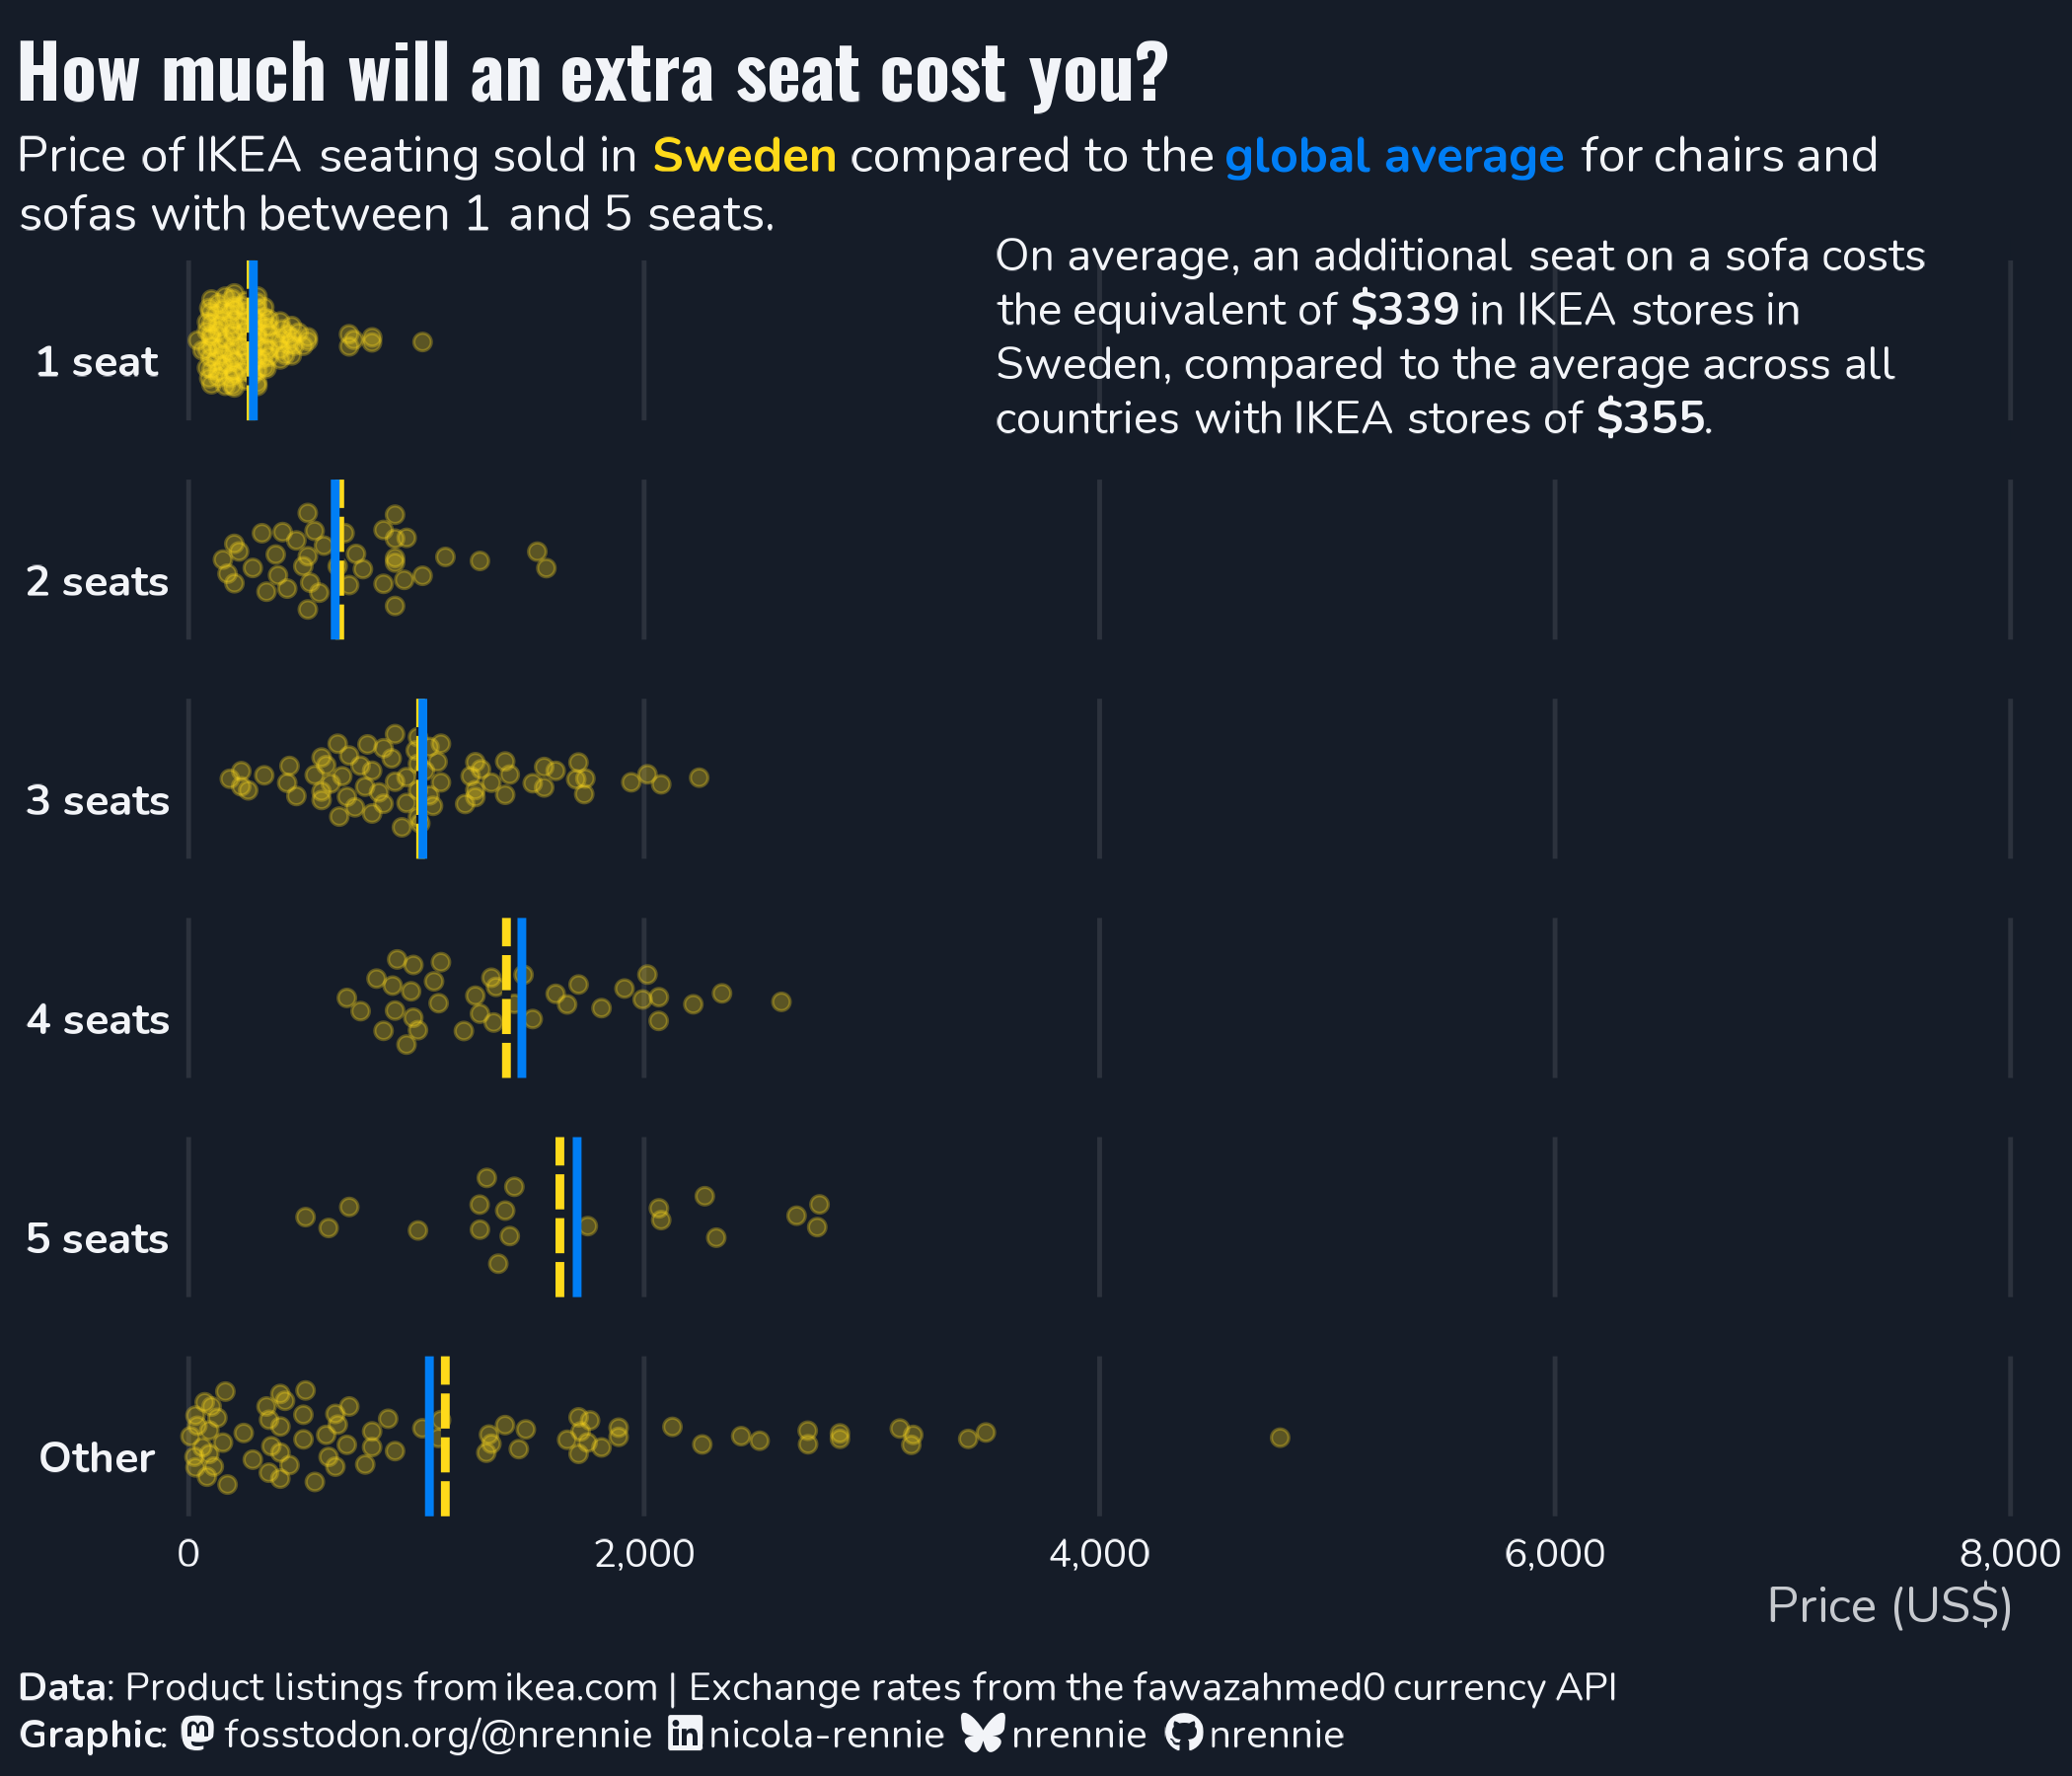
This week's #TidyTuesday data is all about IKEA furniture🪑This was a fun, messy dataset to play with and I ended up with a parameterised beeswarm chart comparing costs for 1-5 seater sofas across the world 🗺️
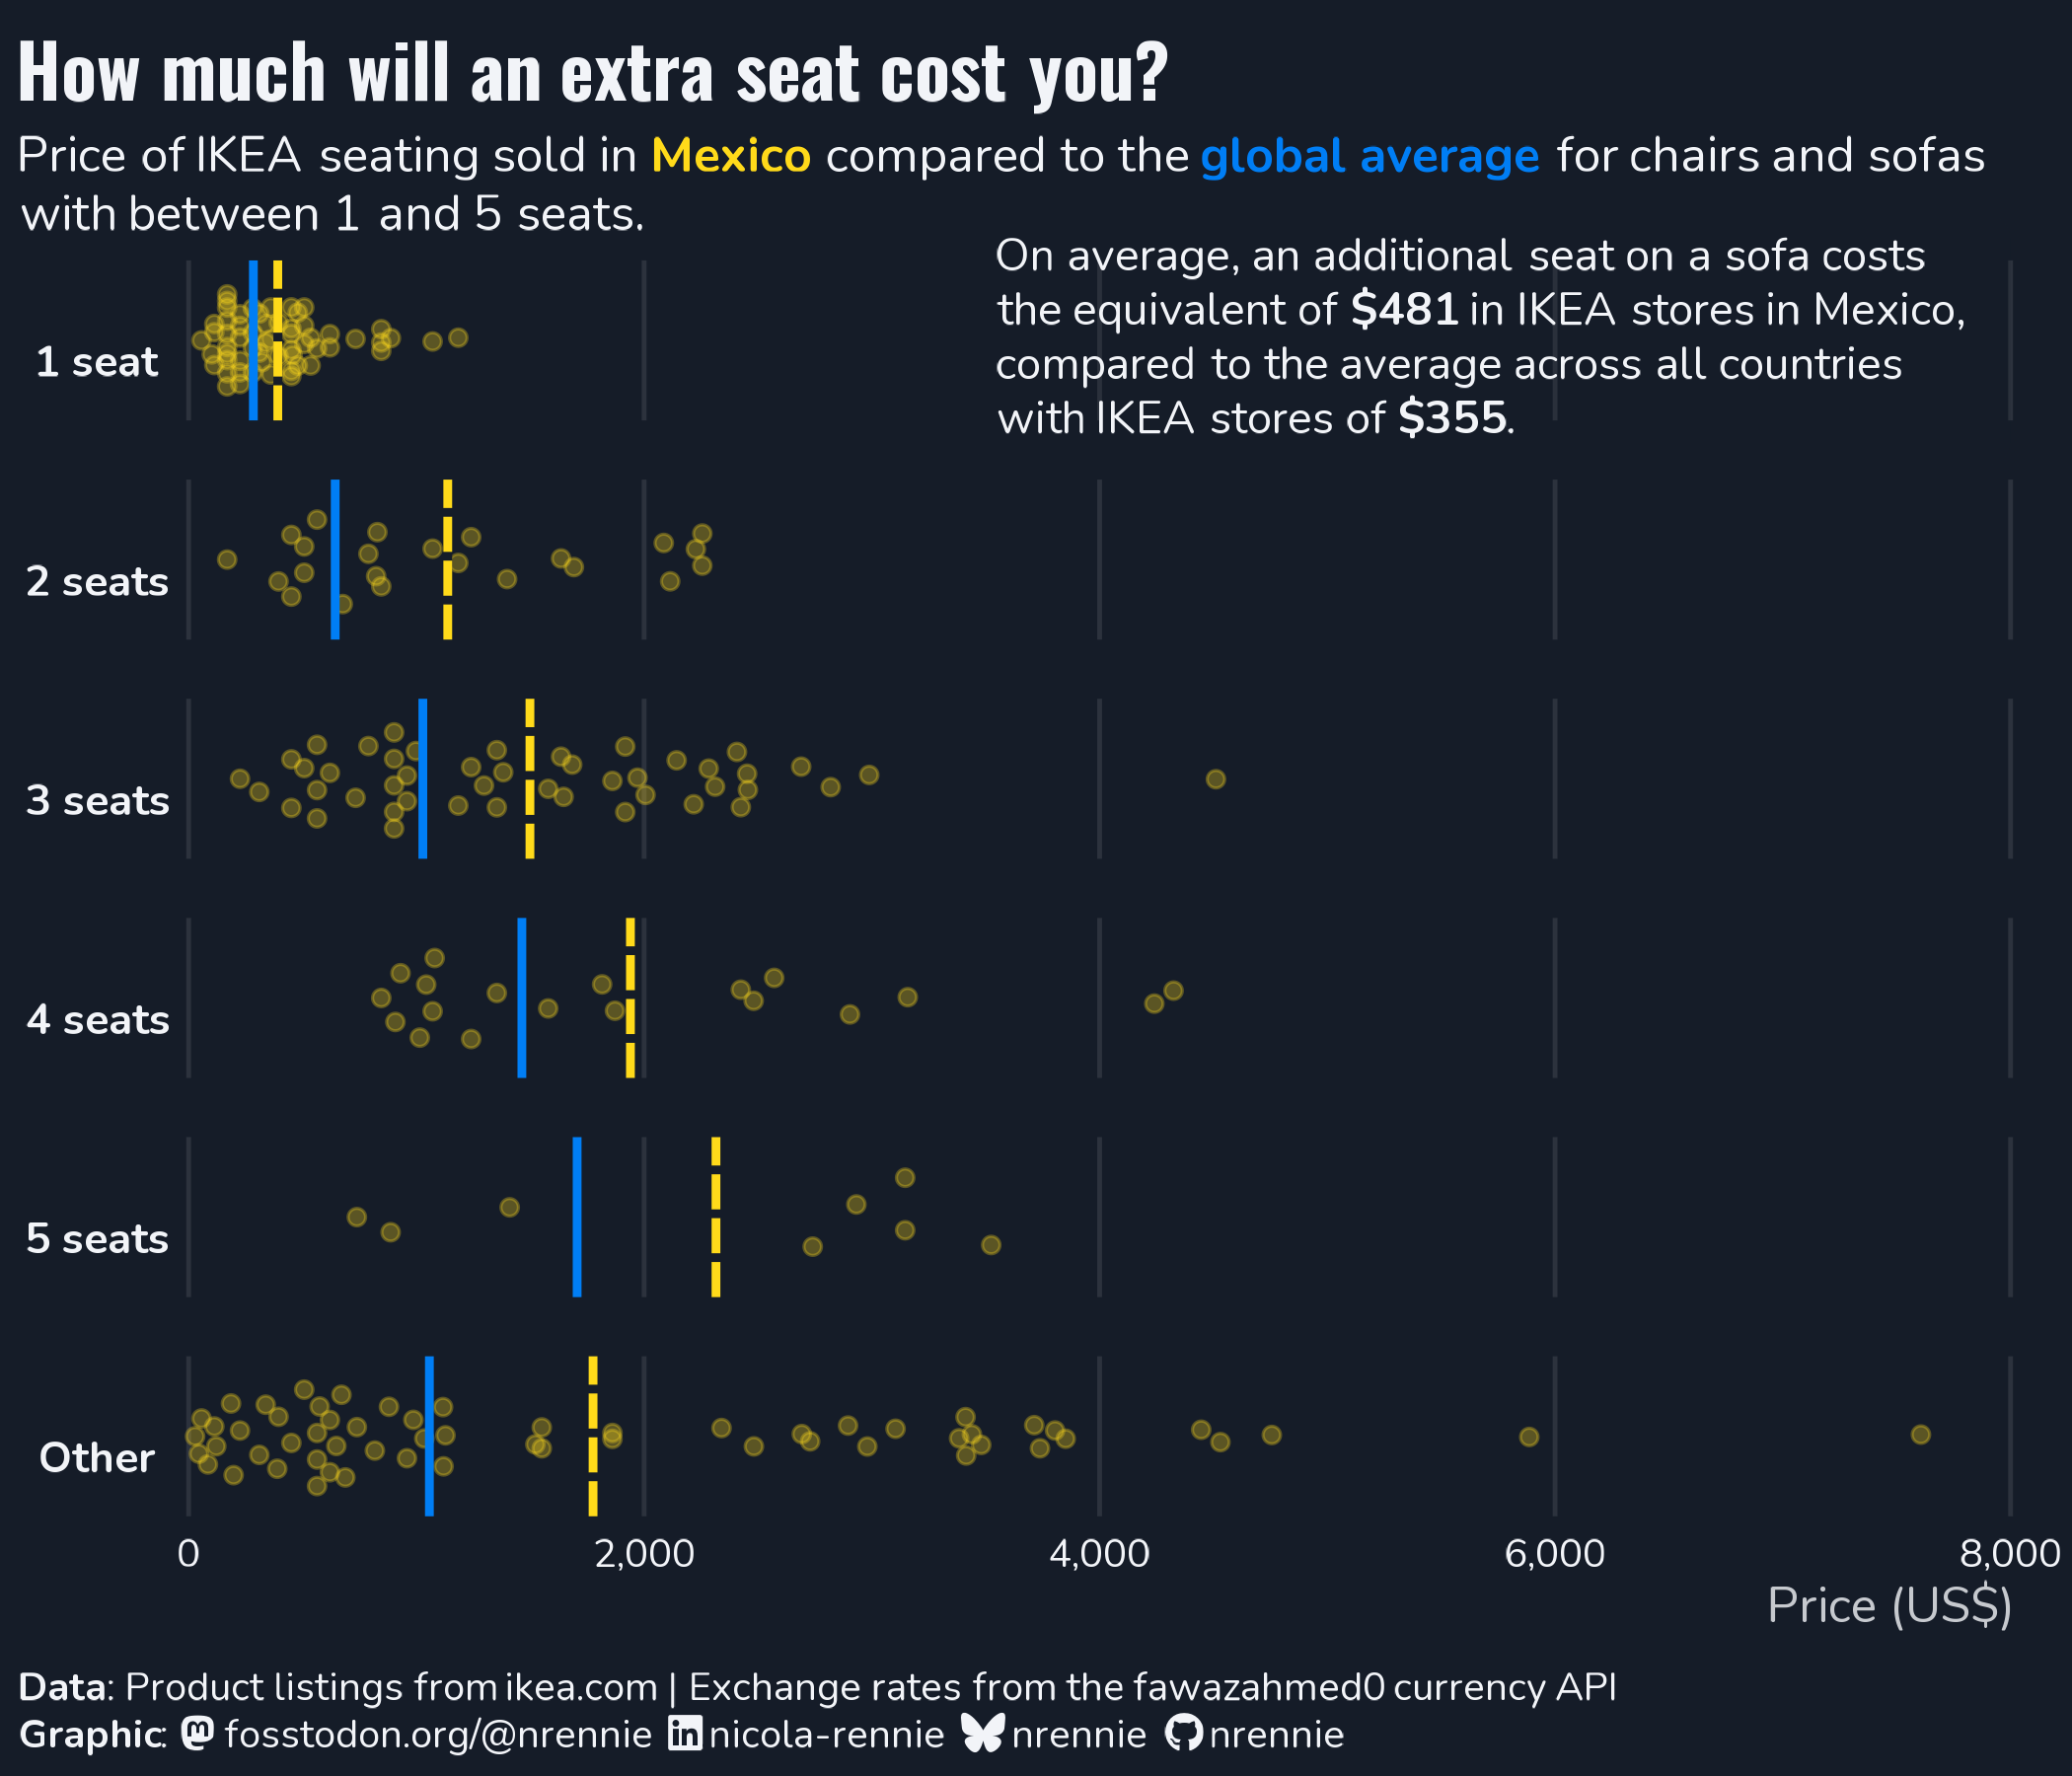
This week's #TidyTuesday data is all about IKEA furniture🪑This was a fun, messy dataset to play with and I ended up with a parameterised beeswarm chart comparing costs for 1-5 seater sofas across the world 🗺️
Since it's parameterised, obtaining a version of the plot for a different country is as simple as `plot_beeswarm("Sweden")`
Code: https://github.com/nrennie/tidytuesday/tree/main/2026/2026-10-27