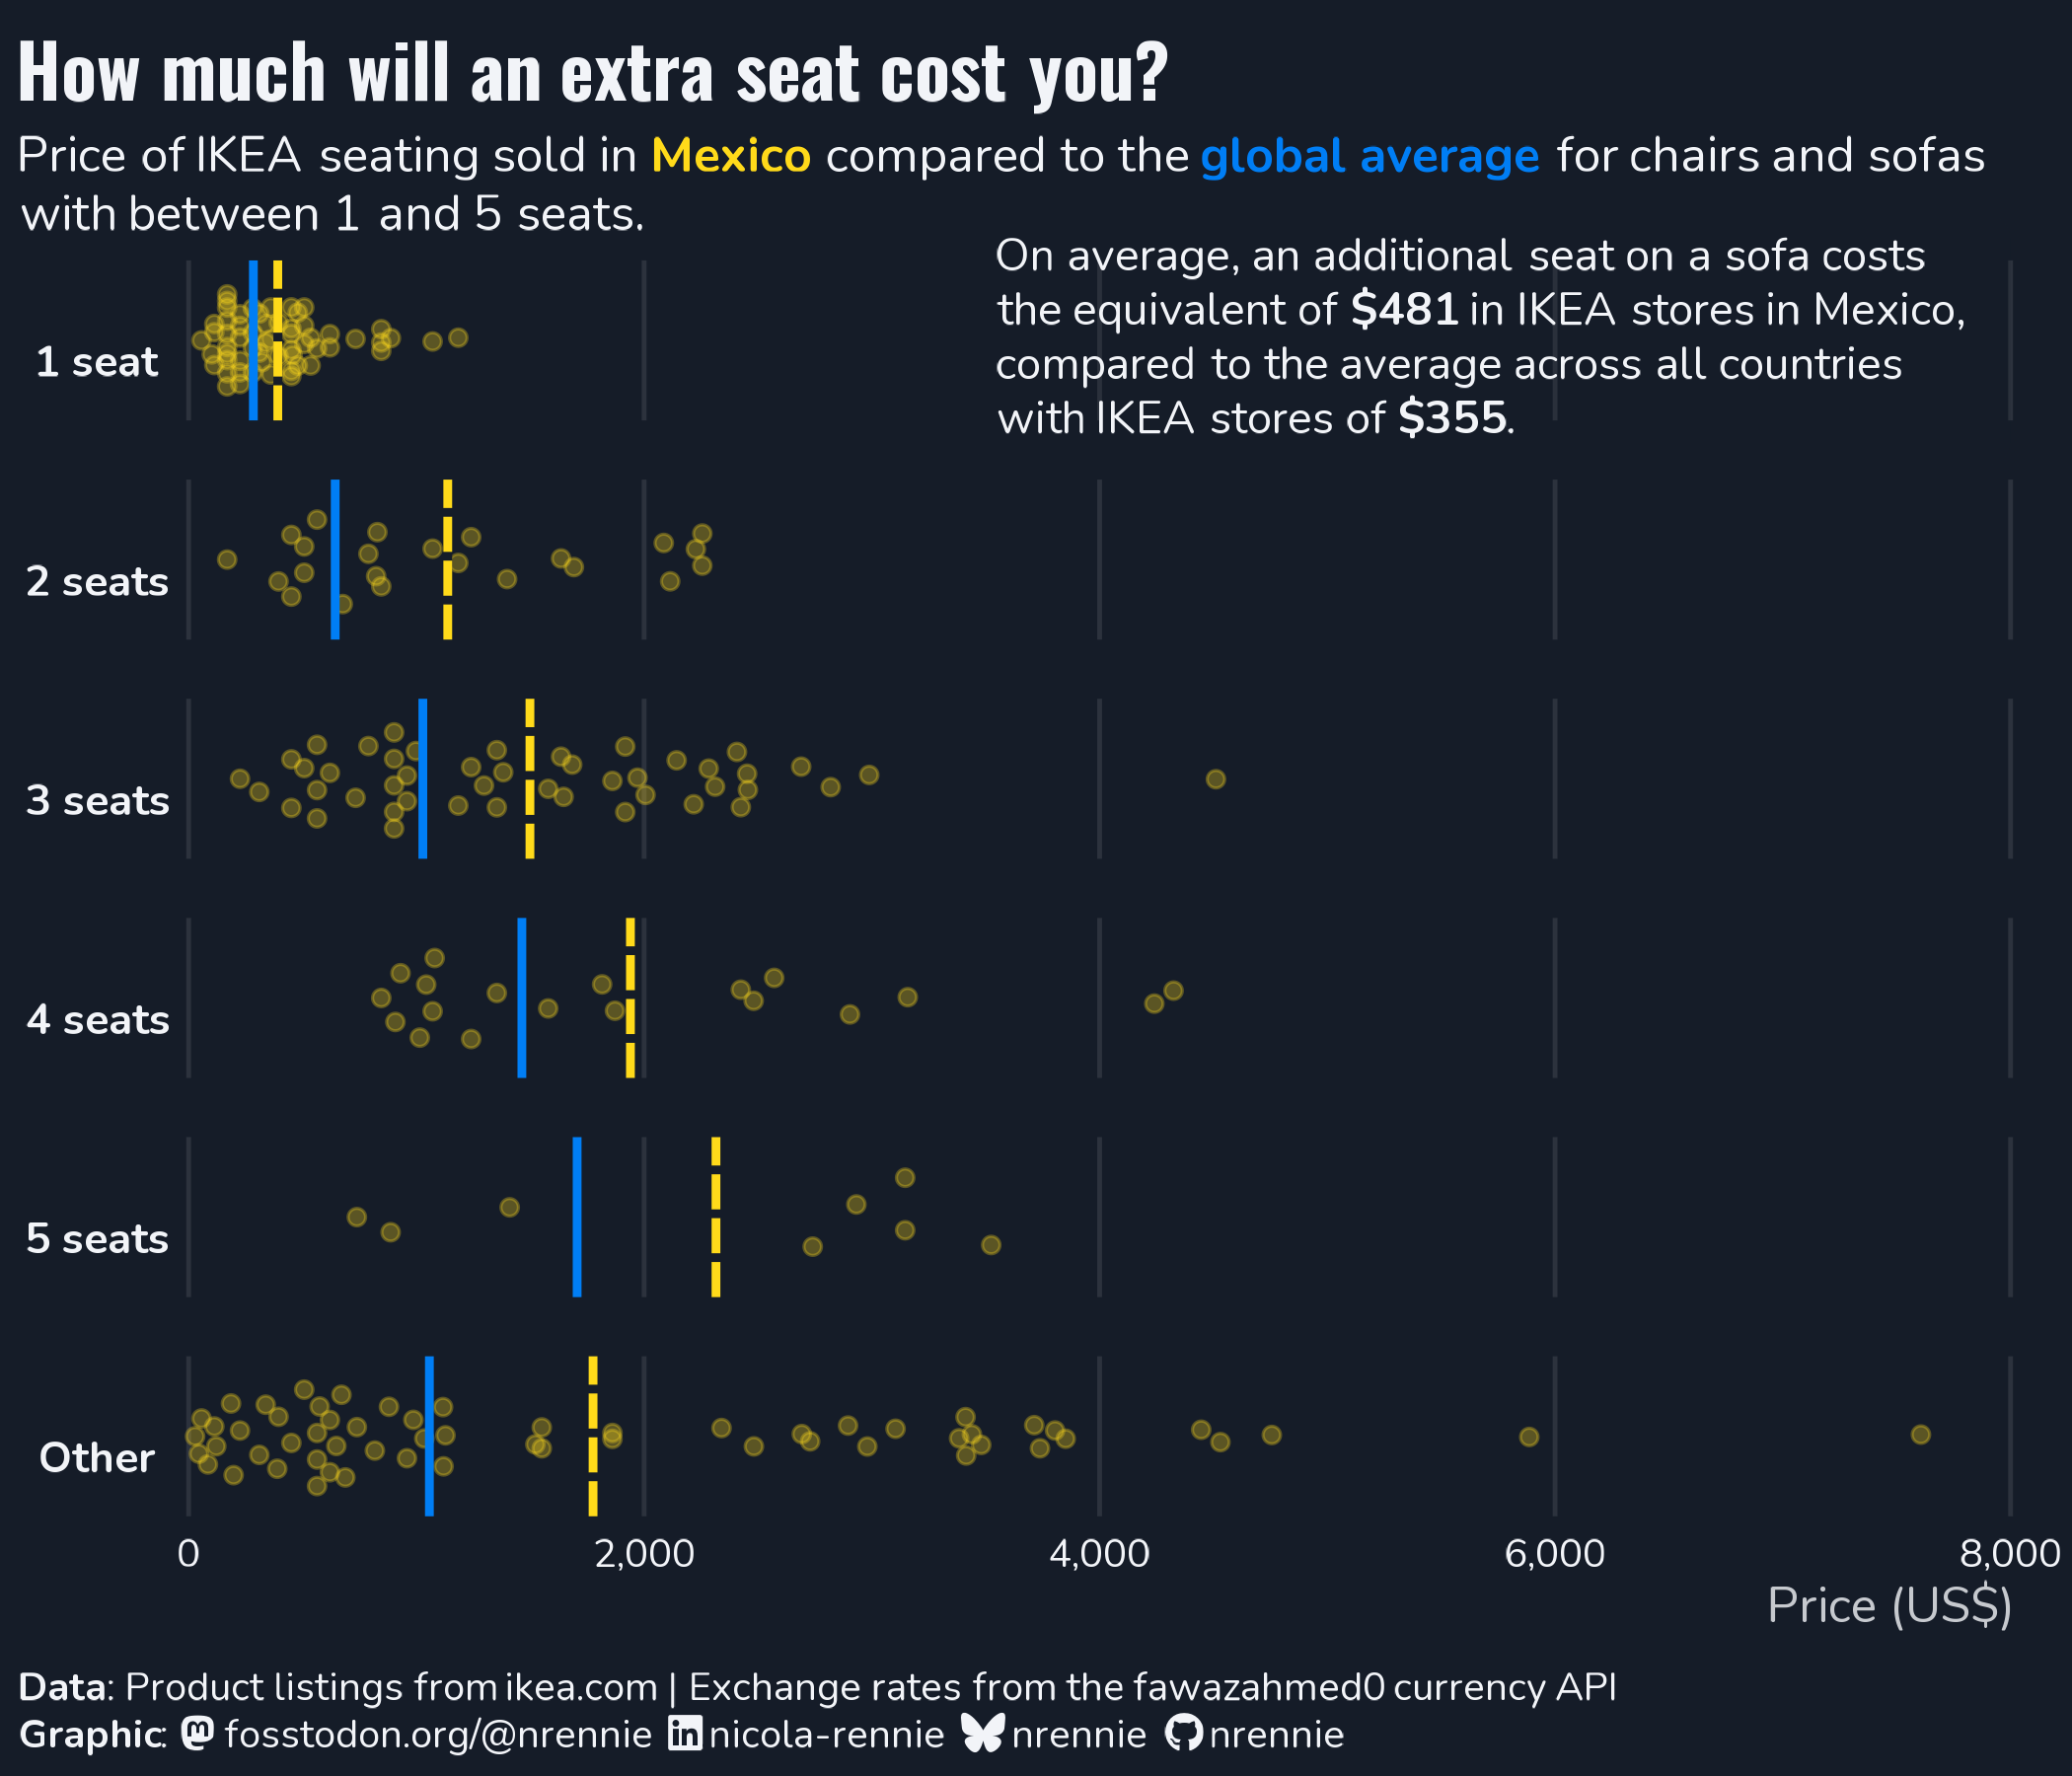
This week's #TidyTuesday data is all about IKEA furniture🪑This was a fun, messy dataset to play with and I ended up with a parameterised beeswarm chart comparing costs for 1-5 seater sofas across the world 🗺️
Public posts with this hashtag.
This week's #TidyTuesday data is all about IKEA furniture🪑This was a fun, messy dataset to play with and I ended up with a parameterised beeswarm chart comparing costs for 1-5 seater sofas across the world 🗺️
If you've ever made an interactive chart and then faced the problem of sharing it with other people, then is blog post is for you 📊
It shows you how to use
🦒 ggiraph to make interactive charts in R
🛠️ htmltools to build dropdown menus
🪄 A little bit of Javascript magic to join them together
All packaged up in a document you can send via email!
Link: https://nrennie.rbind.io/blog/interactive-charts-ggiraph/
 Nicola RennieHow to make interactive charts you can email – Nicola RennieMaking interactive visualisations means you can no longer just send someone a PNG file or a Word document containing your chart by email. Or does it? This blog post will show you how to use R to create interactive charts that are easy to share with other people.
It's #TidyTuesday y'all! Show us what you made on our Slack at https://dslc.io/join (find the #chat-tidytuesday channel)!
RT @jonthegeek https://fosstodon.org/@jonthegeek/117508356824113747
 FosstodonJon Harmon (@[email protected])Attached: 3 images
https://DSLC.io welcomes you to week 43 of #TidyTuesday! We're exploring IKEA Sofas and Their Swedish Places!
📁 https://tidytues.day/2026/2026-10-27
🗞️ https://karaman.is/ikea-place-names
Submit a dataset! https://github.com/rfordatascience/tidytuesday/blob/main/.github/CONTRIBUTING.md
#RStats #PyData #JuliaLang #DataViz #tidyverse #r4ds
If you're starting to think about the #30DayMapChallenge, here are some resources you might find helpful 👇
https://nrennie.rbind.io/resources/maps/index.html
Links to free books, colour palettes, data, and inspiration 📊
 nrennie.rbind.ioMapping resourcesA collection of useful, freely-available geospatial, mapping, and cartographic resources and links.
I have made some refinements to Top of the Hops, my #homebrew #analytics website showing trending apps and packages. Now it should be much easier to identify packages and to check out their own websites.
https://greg76.github.io/toth/
#dev #developer #tools #cli #terminal #coding #agents #dataviz #datavisualization

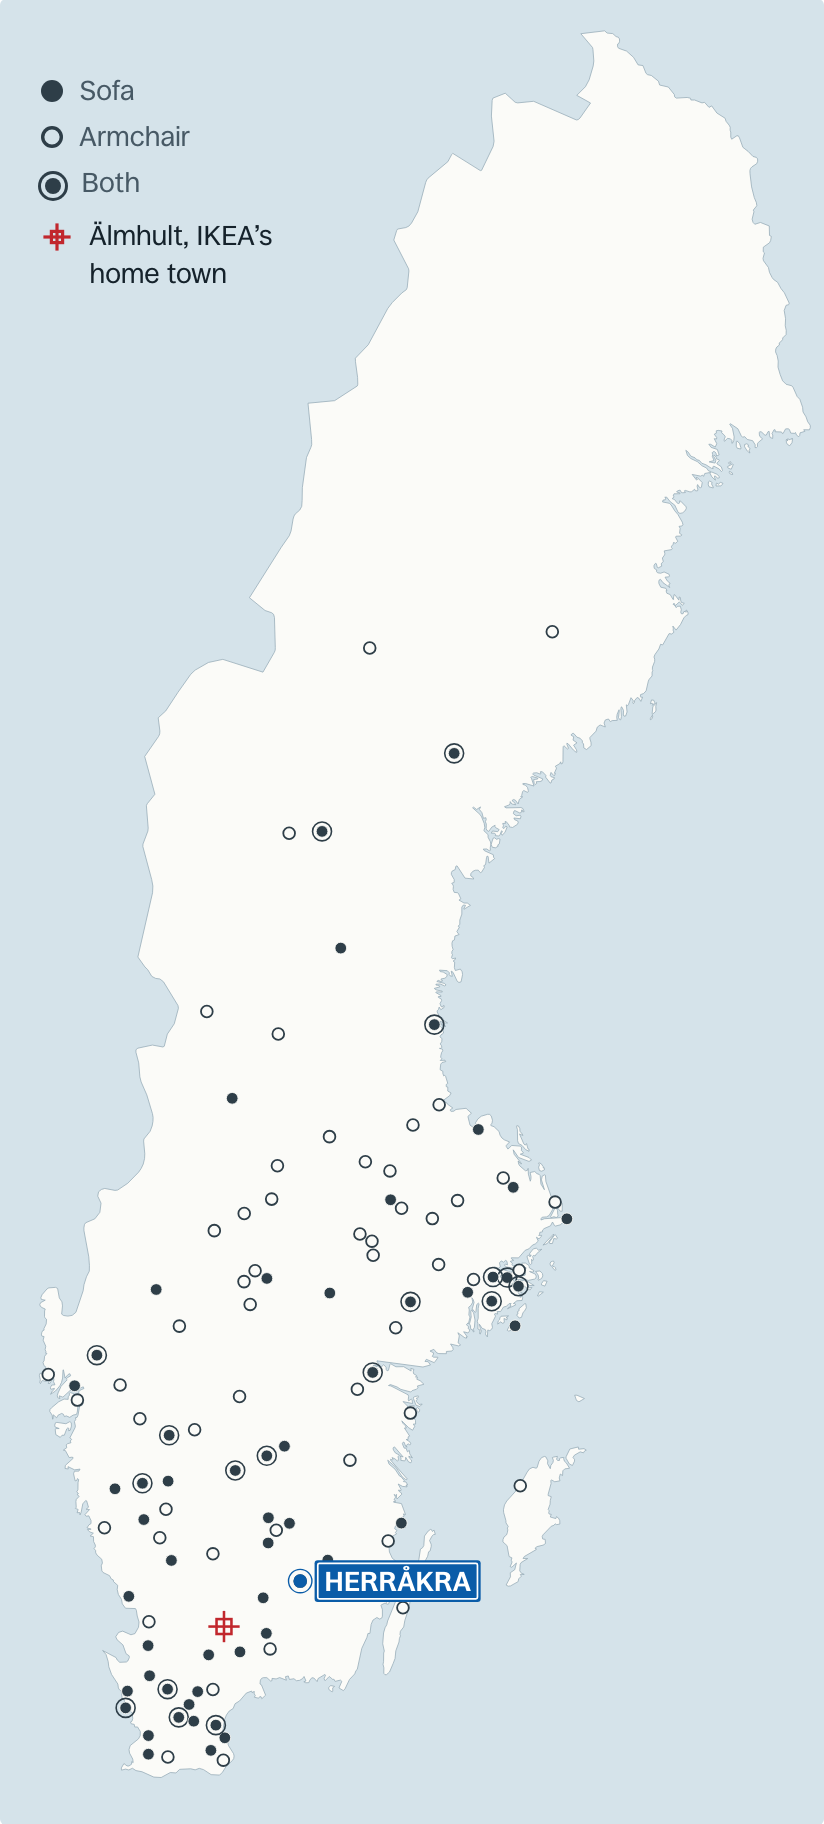
https://DSLC.io welcomes you to week 43 of #TidyTuesday! We're exploring IKEA Sofas and Their Swedish Places!
📁 https://tidytues.day/2026/2026-10-27
🗞️ https://karaman.is/ikea-place-names
Submit a dataset! https://github.com/rfordatascience/tidytuesday/blob/main/.github/CONTRIBUTING.md
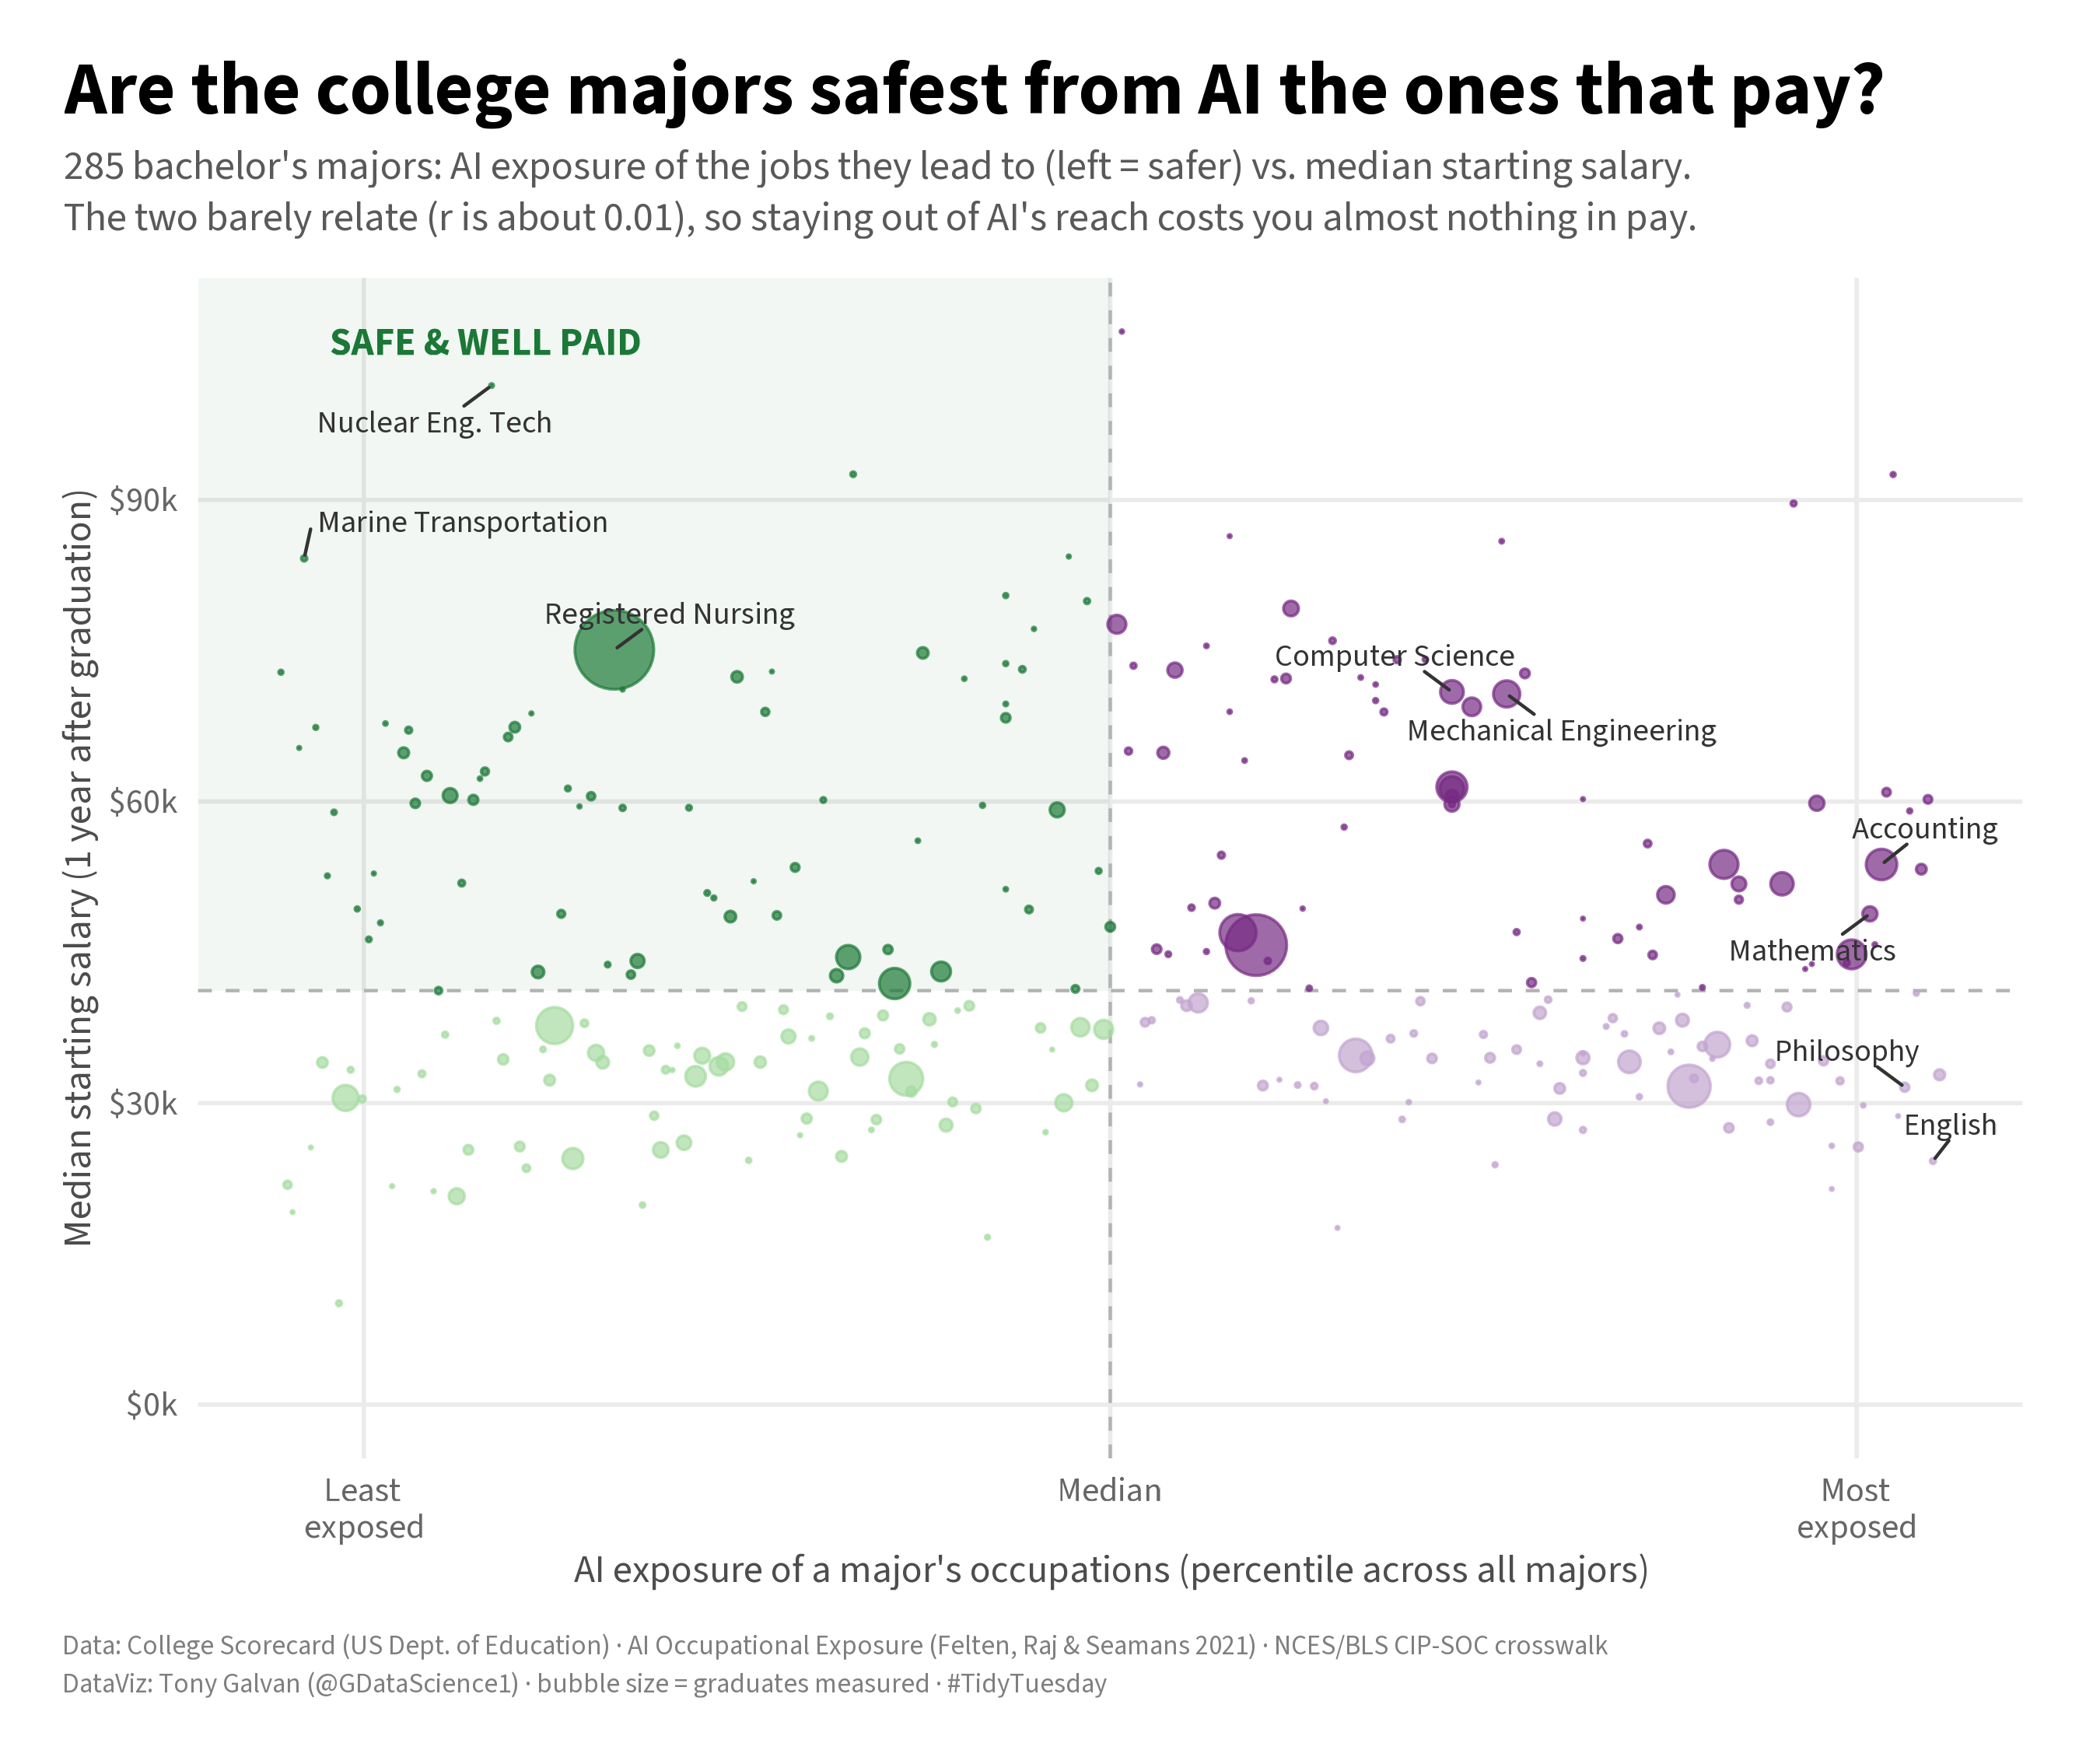
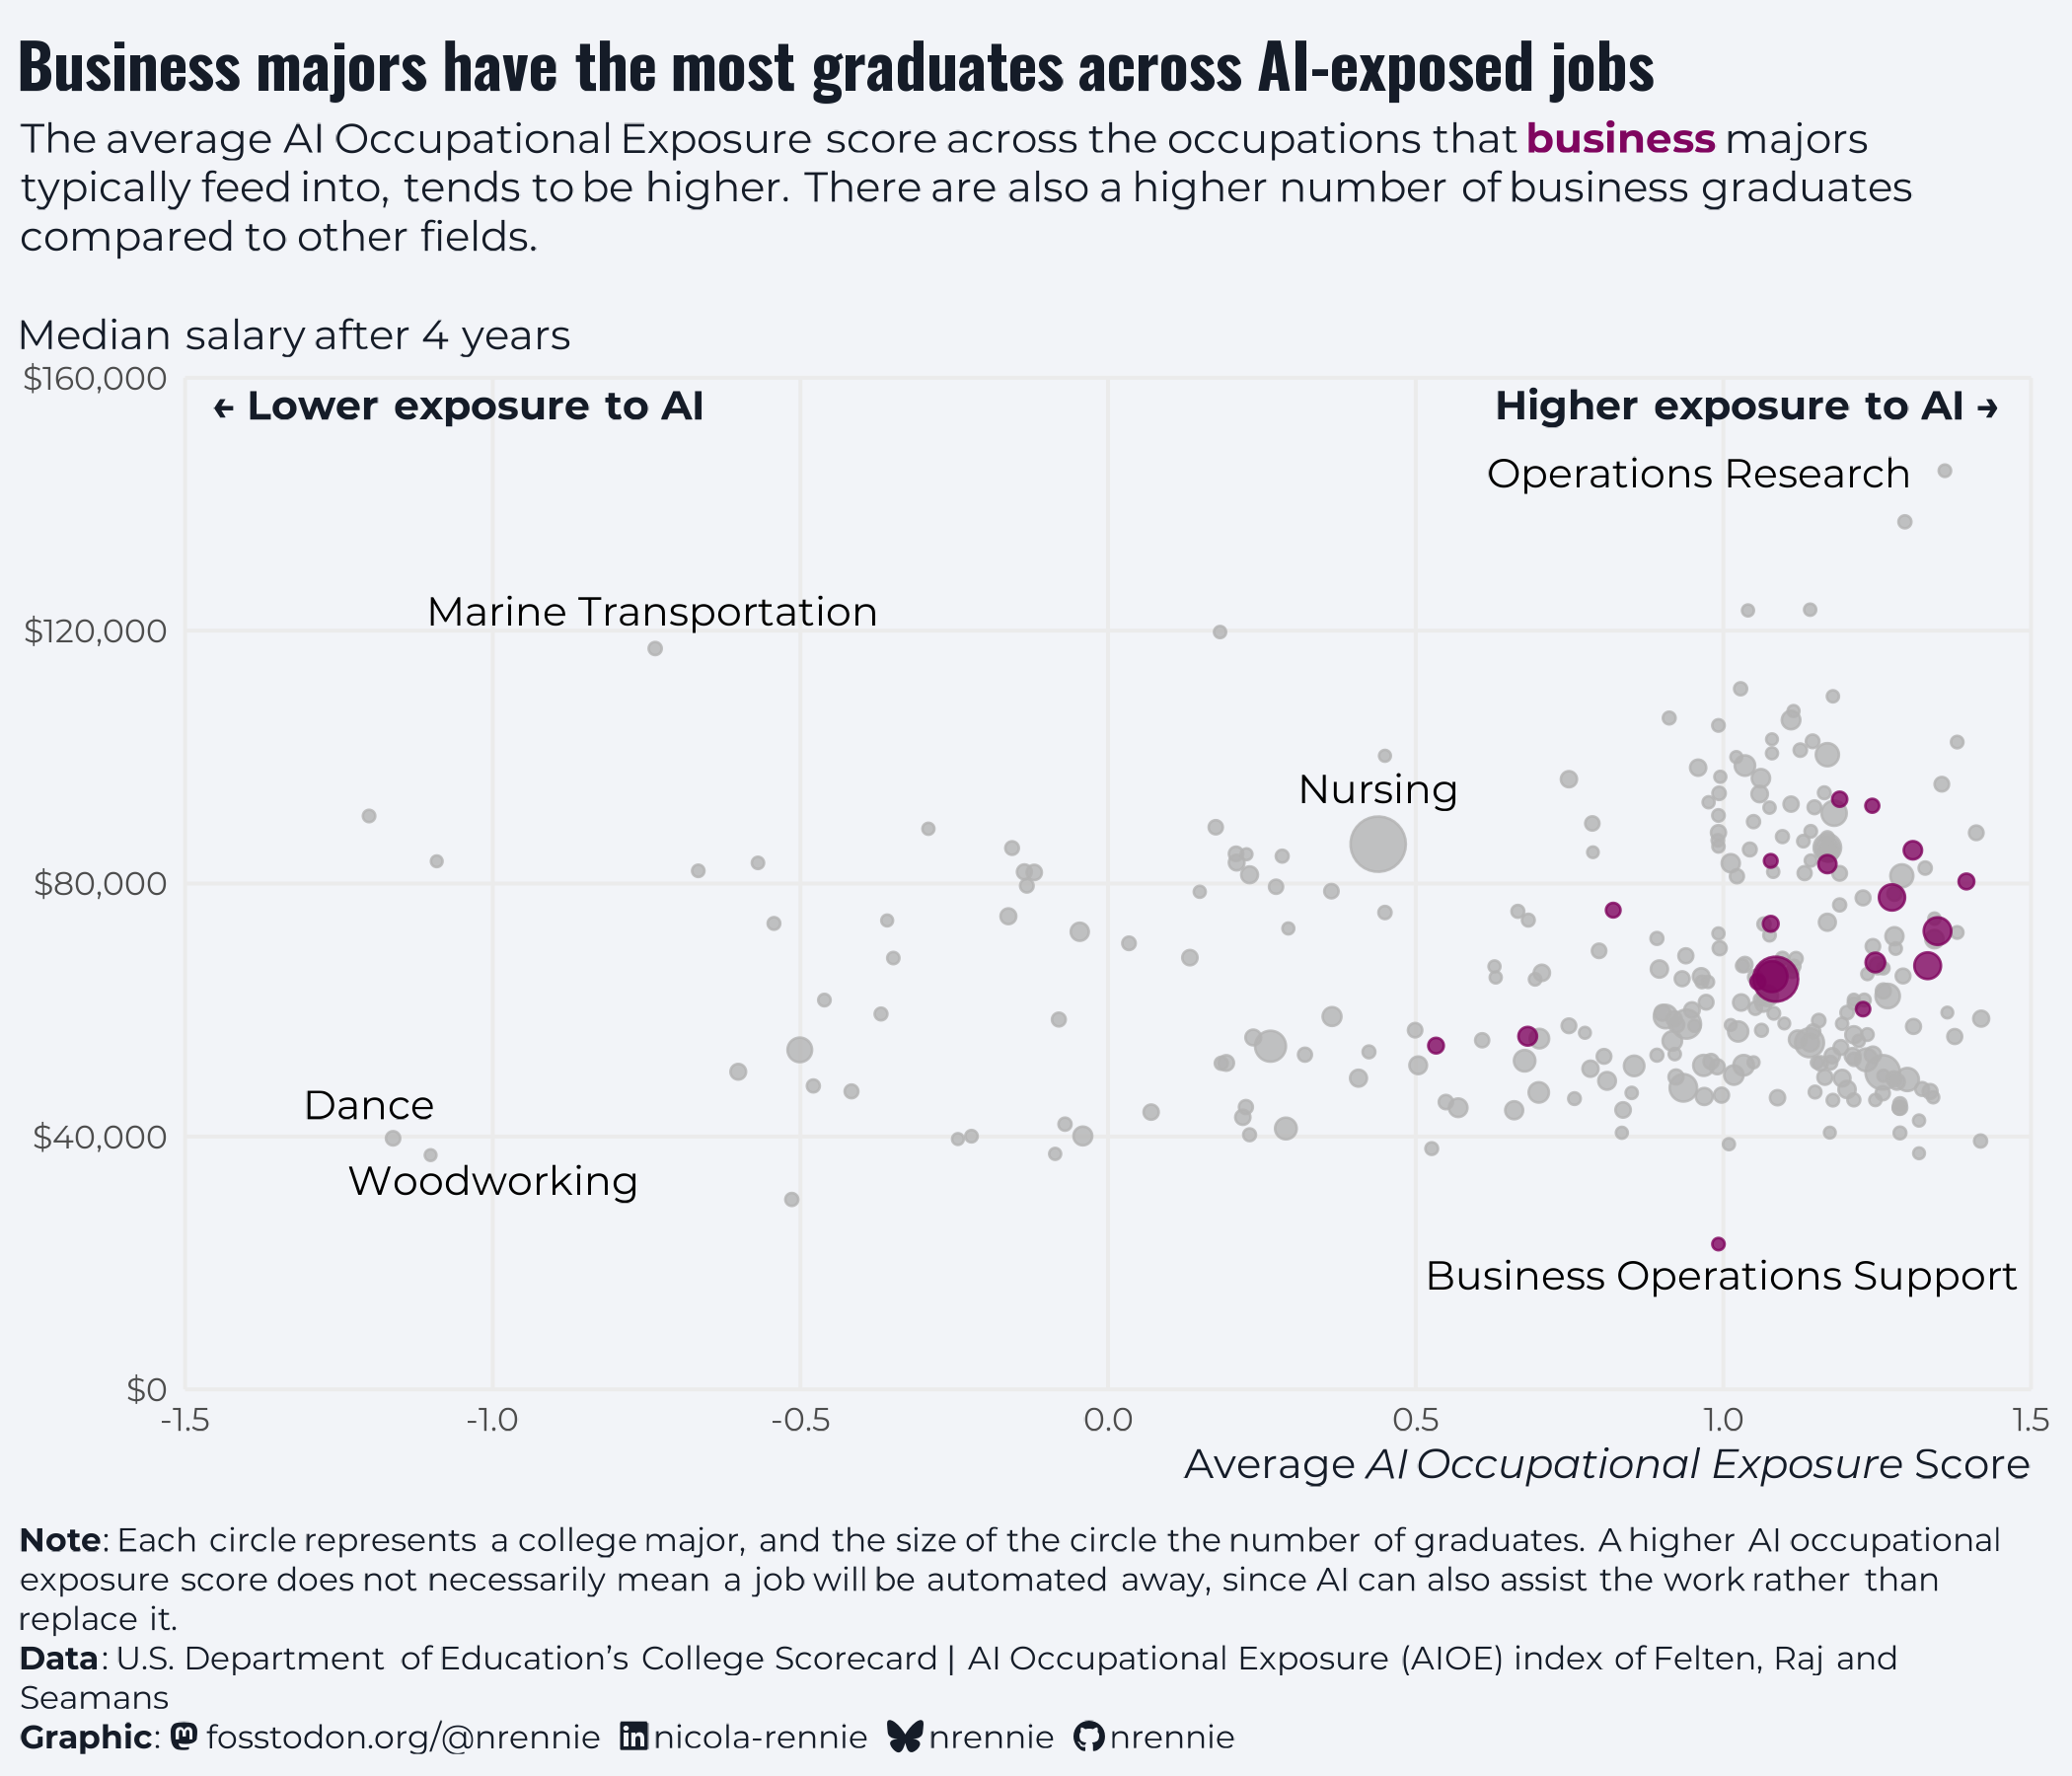
This week’s #TidyTuesday data explores college majors, graduate numbers, salaries, and exposure to AI 📊
Business majors have the largest number of graduates, the bubble chart shows this a large share of graduates are entering occupations with relatively high AI exposure 🎓
Code: https://github.com/nrennie/tidytuesday/tree/main/2026/2026-10-20
It's #TidyTuesday y'all! Show us what you made on our Slack at https://dslc.io/join (find the #chat-tidytuesday channel)!
RT @jonthegeek https://fosstodon.org/@jonthegeek/117468752051438439
 FosstodonJon Harmon (@[email protected])Attached: 3 images
https://DSLC.io welcomes you to week 42 of #TidyTuesday! We're exploring Which College Majors Are Safest From AI (and Do They Pay)?!
📂 https://tidytues.day/2026/2026-10-20
🗞️ https://arxiv.org/abs/2303.01157
Submit a dataset! https://github.com/rfordatascience/tidytuesday/blob/main/.github/CONTRIBUTING.md
#RStats #PyData #JuliaLang #DataViz #tidyverse #r4ds
https://DSLC.io welcomes you to week 42 of #TidyTuesday! We're exploring Which College Majors Are Safest From AI (and Do They Pay)?!
📂 https://tidytues.day/2026/2026-10-20
🗞️ https://arxiv.org/abs/2303.01157
Submit a dataset! https://github.com/rfordatascience/tidytuesday/blob/main/.github/CONTRIBUTING.md